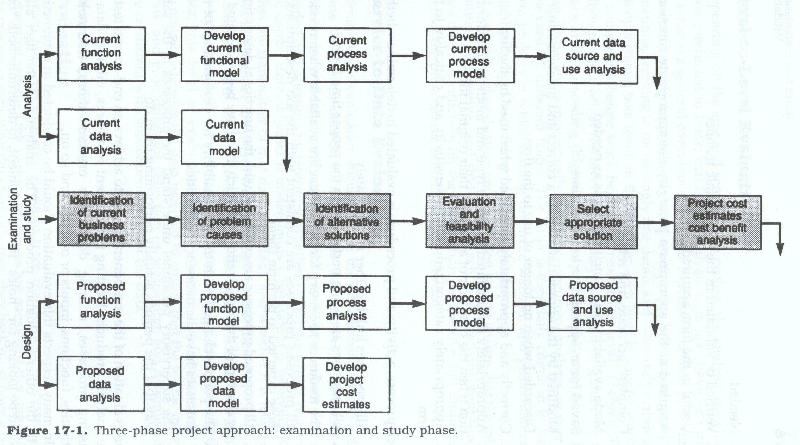
Examination and Study
Evaluation of existing system components
This phase of the system development life cycle examines the results of the analysis, and using both the narratives and models, identifies the problems which exist as the result of misplaced functions, split processes or functions, convoluted, or broken, data flows, missing data, redundant or incomplete processing, and non-addressed automation opportunities.
The activities for this phase as illustrated in figure 17-1 are:
Each system component must be examined and evaluated. Most evaluation is performed at the procedural level. Various techniques can be used during the evaluation process to uncover all the problems inconsistencies, and omissions in the existing system.
Data components are evaluated to determine whether the data gathered by the firm is:
Each process, activity and procedure is evaluated to determine:
The evaluation of the components seeks to achieve an end-to-end test of the analysis products, looking for inconsistent references, missing data or missing processes, missing documents or transactions, overlooked activities, functions, inputs or outputs, etc.
In many respects this evaluation should be conducted in conjunction with the other evaluation processes. The analyst and the user alike should be looking for "holes" in the document, both to determine "correctness" and completeness.
Level to level Evaluation
Depending upon the size and scope of the project, the analysis may have been conducted in levels. That is the analysis team may have first tried to achieve a broad-brush overview of the user function. This may have been followed by a more narrowly focused analysis of a particular function or group of functions, and working in successively finer and finer detail, finally arriving at the operational task level. This leveled approach usually works each level to completion before beginning the next lower level. Although in theory the work at the level under analysis should be guided by the work at the preceding (higher) level, in practice, this may not be true.
The reality is that these levels may be under concurrent analysis, or may be analyzed by different teams. The latter is especially in long running projects where staffing turnover, transfer and promotion continually change the make up of the analysis team.
Level to level evaluation and validation seeks to ensure that the information, perspective and findings at each level correspond, or at least do not conflict with, the information perspective and findings at each of the levels both higher and lower.
Carrier to Data Evaluation
Carrier to data evaluation focuses in on the data transactions to determine whether the data on the documents (data carriers) which enter the firm are passed consistently and accurately to all areas where it is needed.
It seeks to determine whether or not the firm is receiving the correct data, whether it understands what data it is receiving (i.e. what the transmitter of that data intended), and whether it is using that data in a manner which is consistent with its origin.
Since, with few exceptions, the firm collects data on its own forms, and with even fewer exceptions, the firm can specify what data it needs and in what form it needs that data, this level of evaluation, should compare the firm's use of the incoming data with the data received to ensure that the forms, instructions, and procedures for collection or acquisition, and dissemination are consistent with the data's subsequent usage.
Process to Process Evaluation
Process to process evaluation seeks to trace the flows of processes and determine whether the various processes are consistent with each other. That is if one process is expecting data from another, that they both have a common understanding of the data to be transferred. Process to process evaluation and validation seeks to answer the following questions:
Zero-Based Evaluation
This evaluation approach is similar in nature to Zero-Based Budgeting, in that it assumes nothing is known about the existing environment. It is a "Start from Scratch" approach. All user functions processes and tasks are re-examined and rejustified. The reasons for each user activity are documented and all work flows are retraced.
Zero based evaluation should be undertaken where the analysis indicates that the systems, processes, activities and procedures are undergoing resystemization or reautomation. It should also be undertaken where the analysis indicates that the existing systems and automation may have been erroneous, or the environment may have changed sufficiently to warrant this start from scratch approach.
In any case, the analyst should never assume that the original reasons for data being collected or being processed are still valid. Each data transaction, and each processes must be examined as if it were being proposed for the first time, or for a new system. The analyst must ask:
For each report:
For each process:
Problem identification
Although some of the problems with the existing system may have been known or suspected at the time of project initiation, the scope and extent of those problems, and in many cases the reasons for those problems, many not have been accurately known.
The analytical results not only represent the analysts understanding of current environment, and his diagnosis of the problems inherent in that environment, but also his understanding of the users unfulfilled current requirements and projections of his needs for the foreseeable future. The combination of these four aspects of the analysis will be used to devise a design for future implementation. Thus it is imperative that it be as correct and as complete as possible.
It is at this point that the analyst and user, should have the detailed analytical documentation before them, as well as, the results of the evaluation of that analysis.
During the interviews conducted during the functional, process, activity, task and data analysis phases, each user was asked questions which sought to identify one or more of the following processing problems:
Users were asked to identify areas where responsibilities for activities were either not specified, or where responsibility for certain activities were accompanied by the appropriate authorities. Activities where responsibilities were split - where responsibility was shared across multiple functions - were identified.
Identical or highly similar activities which were performed in multiple areas were identified. Activities which appeared to be aimed at accomplishing the same purpose but which were performed in highly dissimilar manners were identified, and the causes for those dissimilarities were identified.
During the interviews, the users were also asked to enumerate processes and activities which were not currently being performed, and which could not be performed or could only be performed with great difficulty in the current environment, but which the users felt should be performed.
As the analysis progressed, the analysts should have been able to identify areas of opportunity. Areas of opportunity result from the synergy between data and process, data and data, process and data. Synergy which has created the ability to achieve a corporate mission or goal, or to provide a new service, or create a new product, or provide new information about the firm's products, competitors, customers or markets, but where that opportunity has not as yet been identified or taken advantage of.
System Design Requirements Document
The product of the Examination and Study phase is document which is usually referred to as a System Design Requirements Document, or a Client Requirements Document. This document classifies, catalogues, and enumerates all existing and identified problems and opportunities, by function, processes, activity, task and procedure. For each of these it lists the change requirements or specifications - the specifications and requirements for correcting the problems or the possible methods of taking advantage of the identified opportunities.
Simply stated, this is the verified documented list of all of places and ways where system and procedural changes have fallen behind the business activities which they were intended to support. It also documents all of the ways where the users anticipate changes to occur, or where changes which have occurred have created opportunities to take advantage of recognized synergism within and between business activities and among the resources of the business.
Prioritization of changes
Each item pair - problem and requirement or specification, or opportunity and proposed method or approach - is evaluated against all other pairs and prioritized. The prioritization may be performed by any one of a number of available methods such as:
The above methods (and variations thereof) are the most prevalent ones and while they accomplish part of the goal of analysis, and are necessary there are two other rankings which should be performed by both the user and the analysis and design team. These are dependency ranking and synergy or impact/benefit ranking.
Dependency ranking
Dependency ranking seeks to determine item dependencies, items which form the foundation for other items, or which items must be accomplished before certain others. This assumes that there are three types of changes which must be made during any new system design.
Foundation Changes - changes upon which all others are based. These include changes in charter, responsibility assignment or technology; Development of a new product or service, new technology; Selection of a new market; Finalization of corporate reorganization, Movement to new location, or modernization of existing location, etc.
Architectural And Procedural Changes - changes which once the foundation items are determined can be designed and developed. These are basic structural changes, and form the bulk of the difficult and usually time consuming system design tasks. These include changes in data gathering, validation, verification, storage and evaluation procedures. The also include all of the activities which aggregate and regroup those procedures to activities, the activities to processes, and the processes to systems.
Presentation, Display Or Cosmetic Changes - many changes which have been identified result from changes in user perception and perspective, or from increased user awareness of his environment and needs. These result in requests for changes in report form and content, faster access to existing data, or improved methods of accomplishing existing tasks. These changes usually do not require structural or architectural changes. Each of these changes while small in itself, when added to the vast number of other similar changes may require the largest part of the design team energy.
Synergy or impact/benefit ranking
Synergy or impact/benefit ranking is the most difficult task to perform in this phase but it is also the one where major benefits to the firm exist. Although it is termed a ranking, in reality it is the examination of each item or combination of items (the items in this case being proposed changes or modifications) to assess;
Cost benefit ranking
The Examination and Study phase usually includes a cost benefit analysis of each proposed change, and an evaluation of the costs and benefits of each change with respect to its various rankings and prioritization. The item by item cost benefit analysis provides another (and sometimes the most definitive) method of evaluating the proposed change specifications and requirements.
Cost Benefit Analysis
The Examination and study phase is completed when a cost benefit analysis is developed for the system design phase for the selected approach.
A system design project will require the expenditure of a certain level of resources, both in terms of manpower and other assets. In effect the firm is buying a product, the completed work and the accompanying document, from each phase. In order for user and data processing management to assess the relative value of each of these products, in advance of their being contracted for, many firms require a separate justification document, called a cost benefit analysis. This document provides, in estimate form, the costs for producing the product, and the benefits which the firm can expect to accrue as a result of that effort.
In the early stages the project has little form or definition, thus early cost benefit documents are predominantly based upon estimates. As more and more information is developed these cost benefit documents become more and more detailed. and more and more accurate.
Cost Benefit Analysis (CBA) is used in two ways. The first being to develop estimates for project budgetary planning and later actual costs for project monitoring purposes. This is usually done at each phase of the development project. This allows Data Processing management to assess whether the costs of the project can be justified by the potential benefits to the user and the firm. The second is to develop user costs and benefits which will result if the project is implemented. This allows user management to plan future budgets and to estimate when the costs will be incurred. Although the costs in the first CBA contain only project costs, the costs in all succeeding analyses should also contain separate projected user costs for implementation and on-going operations.
The first cost benefit analysis is usually performed at the project initiation phase and is used by user and DP management to allocate a budget for the first phase. At the end of the problem identification and analysis phase a second cost benefit analysis is normally generated. Since work has already been performed, and the scope and direction of the project are fairly clear, this document can be based upon the concrete information as to costs and benefits. The development alternative selected will allow hardware and software costs to be added, as well as user documentation and training costs to be estimated. At the end of the Proposed Environment Analysis phase user costs should be well defined and fairly accurate numbers generated.
During the problem identification and analysis phase, it is usually necessary to perform a separate CBA for each alternative being evaluated. These alternative CBA documents can assist in making the selection between multiple viable alternatives.
Project Development Costs
All costs which can be expected as a result of thus unit of work should be estimated and itemized. Cost figures are usually generated by the project manager and the systems analyst assigned to the project. Generally, these costs will be broken out into several categories:
The first, and perhaps the most important category is that of direct manpower costs - these costs are developed from the project plan for this phase. From that plan, should be extracted the number of people, at each level, and the number of periods (hours, days, weeks, months, etc.) that each person will be working on the project.
A per period costs should be assigned on any one of the following bases:
When developing these costs, be sure to include
User and Project Implementation Costs
Aside from the costs to be incurred in the project itself, there may be ongoing costs to be incurred when the project is completed and implemented. These costs fall into the same basic categories as project costs, with the difference that the costs are developed for the user area staff, etc.
In addition to the above costs, the following might be included:
Benefits
Benefits are usually more difficult to quantify, and most benefits are shown in estimated form, especially during the early stages of a project. In many cases, these benefits numbers are obtained form the user requesting the project.
They are determined by quantifying the costs of the existing environment and problems, or by estimating the savings from rectifying these problems. Benefits are usually broken out into two sub-categories - Direct Benefits and Indirect Benefits.
Direct Benefits - are those whose value can be calculated or estimated in monetary terms. These include savings or reductions in:
The benefits here are estimates of those reductions of such costs which might be achieved through more efficient processing if the project is successful.
In some cases the benefits may be achieved through actual increases in revenue, or faster collections, or more rapid turnover, or increased productivity. Some examples of benefits to be looked for, and estimated, in this area are:
Indirect benefits - are those which can't be quantified, or assigned a monetary value, but which nonetheless result in desirable outcomes from the project. These might include:
A cost benefit analysis may be as short as a single page or may cover many pages. In format it is similar in style to a standard budget, with costs being equated to the expense side, and benefits being equated to the income side. All cost items should be subtotaled by category and an overall total cost figure computed. All benefits should be subtotaled by category and a total benefit figure computed. In more complete cost benefit analyses, both the costs and the benefits would be "spread" across the project or phase time frame, with the costs and projected benefits.
The data requirements of the operational level units, while extensive, rarely change since they are contingent upon fixed sources of input.
Additional analysis techniques
Many other techniques are used during the Evaluation and Study process to gather and analyze data, some of which are shown in Table 17.1, Examination and Study Techniques. The set of tools used during any given project depends upon the approach selected.
Table 17.1. Examination and Study Techniques
Techniques |
Description |
Activity Based-Costing |
An Accounting technique which allows an enterprise to determine the actual costs associated with each product and service produced by the enterprise without regard to the organizational structure of the enterprise. |
Activity Modeling |
A technique to identify framework of essential activities performed by an organization. |
Bench marking |
Method of measuring one's own processes against those of recognized leaders. It helps to establish priorities and targets, and leads to process improvement. Benchmarking is growing in popularity, although its success is determined by the fit with the firm chosen as the benchmark. The benchmark firm should be in the same industry, should have the same kinds of customers, products and competitive environment. Although some processes can be compared where the firms are substantially different, the results are unpredictable. |
Business Event Analysis |
Events are changes in the state of an entity used by a process. When an event occurs, it usually triggers execution of a process. Business event analysis is another level of analysis that is applied to processes that have been stabilized and documented. A process is considered stable when its performance measures are reasonably consistent. The impact of isolated events as they occur against the process are measured and analyzed. The goal of business event analysis is to identify processes that are stable, processes that can react to events without suffering major degradation in performance. |
Change-Orientation Matrix |
A tool to help identify where individuals stand in their willingness to adopt a particular change outlook This matrix is predicated on the reality that individuals typically pass through a series of stages ranging from denial to commitment when dealing with a change condition. The more willing both the individuals and the group as a whole are to change the greater the chance for success. |
Critical success Factor |
A tool to identify the most important areas which, if performed (CSF) Analysis will tend to ensure success. Critical Success Factors should be clearly measurable, and controllable. Each critical success factor should have an objective goal associated with it and progress toward that goal should be charted. Clear responsibility should be established for the achievement of each CSF. |
Data Flow Diagram |
Depiction of information flows within the functional areas. Identifies major functions, external entities, systems and information. |
Data Modeling |
Technique to define the data structure and relationship of data items used by the functional/organization. |
Force-Field Analysis |
Force-field analysis sees a problem as a balance between forces which push it towards a desired state (driving forces) and forces which inhibit such movement (restraining forces). In organizations, any situation is affected by such forces, even if it appears static. To change the situation, one must change the balance of forces. |
Graphs |
Graphs are among the best and simplest techniques to analyze and communicate data. The following are the most common forms of graphs used. during the analysis and examination and study phases. |
Bar Chart |
Shows a comparison of quantities by the length of the bar - which represent them |
Line Graph |
Uses lines rather than bars to illustrate data |
Control |
A graphic representation of measured actual process performance |
Charts |
Used to show the variation on process variables and identify special causes, relative to computed control limits |
Histograms |
A graph which displays frequency of data in column form |
Scatter |
Diagrams which depict the relationship between two factors |
Mission Analysis |
Disciplined approach to defining the reason why organization exists (its official charter, mission, goals. and objectives). This usually involves interviews with senior executives, staff and line management and representative non management employees. These interviews attempt to determine whether the management and employee view of the company mission reflect the published versions. It also examines representative company sales, public relations and shareholder literature to determine if there are any inconsistencies between their view of the firm and the stated or official firm mission or charter. |
Pareto Diagram |
A bar chart in which the bars are arranged in descending order, with the largest to the left. Each bar represents a problem. The chart displays the relative contribution of each sub problem to the total problem. This chart observes the 80/20 rule, which states that for most types of events, the majority of instances are found among a small portion of the possible circumstances |
Selection Matrix |
An effective tool for narrowing a list of items to one, or at least to the few most important, based on predetermined criteria. The process used tends to reduce subjectivity and emotionalism and instill objectivity through use of discrete selection criteria. The matrix lists all selection criteria, maximum score, evaluation standards, and the weight if any given to each criteria relative to other criteria. Selection matrices may identify which are mandatory and option criteria, or they may identify several levels of criteria importance. |
Value Chain Analysis |
Facilitates analysis of flow of information and the inter- and intra-organizational dependencies involved in performing various activities. Value chain analysis follows each specific product through the organization and documents the value added by each organization from start to finish. Value adding activities improve the item, contribute to its production, distribution, completeness or quality./p> Non-value adding activities add to cost but not necessarily anything to production, distribution, completeness or quality. Many overhead activities including internal documentation, meetings, reviews and many accounting activities are non-value adding activities. |
Risk Identification And Mitigation
All projects have risk associated with them. All change, even the most trivial have associated risk (the least being that the change won’t achieve the desired result.) Risk management is the combination of processes and procedures for managing areas of risk associated with a project, or with the changes proposed by the project. Risk management will:
Four steps of risk management:
Risk Identification. This activity identifies and evaluates the risk and its source. The risk evaluation should include identification of metrics for evaluating progress and determination of the risk impact (e.g., cost, schedule, and/or technical performance, business efficiency, product safety, customer perception, legislative and regulatory impact. ).
Risk Assessment. This activity consists of risk analysis, qualification, and quantification. The effect of the risk on the system, the seriousness of the risk, the priority (high, medium, low) of the risk, and the size of the risk should be determined.
Risk Containment. A containment plan should be developed to mitigate each risk. Included in the containment plan should be the identification and method of collection of metrics to be used for evaluating progress in containing the risk, the progress evaluation schedule milestones and reviews, and responsibility for evaluating performance against plan. One or more approaches or contingency plans for containing the risk should be identified. Each individual responsibility for containment of each risk and should be documented.
Risk Closure. Authority to determine that a risk has been closed should be identified. Each area of risk should be clearly documented and the status of the progress toward containing or eliminating each risk should be regularly documented clearly indicating both open and closed items.
As risk conditions are eliminated or as the containment activities are completed and considered closed, they should be removed from the open item and logged in a history file with appropriate documentation reflecting how they were eliminated or closed, who performed those activities and who authorized closure, and when.
Risk Issues
Potential risk issues associated with changing any business processes include:
A Professional's Guide to Systems Analysis, Second Edition
Written by Martin E. Modell
Copyright © 2007 Martin E. Modell
All rights reserved. Printed in the United States of America. Except as permitted under United States Copyright Act of 1976, no part of this publication may be reproduced or distributed in any form or by any means, or stored in a data base or retrieval system, without the prior written permission of the author.