Modeling and Systems Design
Whether they describe the plans and proposals for new or modified procedures, data files, forms, reports, documents, or work flows, all system design components have a common intangibility. While the final procedure, document or report can be picked up and examined, the proposed procedure does not yet exist. Data, unless it is recorded on some physical media such as paper, or film, has similar intangibility as does the concept of a work flow. The reason for a design is that one can prepare something in advance of its construction and examine it for suitability and conformance (at least in a macro sense) to what is needed, desired, and anticipated by the user. Most designs are prepared in enough detail so that a suitable and informed evaluation can be made. However, they stop short of the detail of the final product.
In many instances the system components which are included in the design will never have physical existence and will always have something else to represent them. This is especially true of system components which are to be automated and where the final procedures, data files, and system framework will exist as impulses on magnetic recording media.
Given the intangible nature of these system components, and the fact that tangible or not, we are describing something which has not yet been constructed or developed, how can we describe these things?
To overcome the intangible nature of these components, and as a aid to describing the proposed components of all types, all business system designs use a combination of narrative and graphics to represent those proposed components.
Many methodologies incorporate forms, special charts and graphs as mechanisms for describing the system design components. These descriptive and diagrammatic aids provide stylistic and notational consistency to the design documentation but can provide little assistance to the designer in terms of a step by step approach to develop content.
There are as many different methods and styles of narrative as there are writers of narrative. There are probably an equal number of graphics notations used. It is not our intent here to either describe all of them, or even list all of them. We have selected a few which are more or less widely used to illustrate the concepts we wish to present. Any notation can be modified to represent anything the illustrator wishes. One must only be clear on how the notational symbols are being used (what each one represents) what their meaning will be when used in combination, and that the items being represented are clearly labeled.
There are many different types of business models which can, and which in fact are used in the system design process. Each of these depicts a particular aspect of the proposed business system, from a particular perspective, and to a particular level of detail. Models can be built from the bottom up - that is beginning with extreme levels of detail and aggregating upward (integrating) to more and more composite models - or they can be built from the top down, developing progressively more levels of detail by decomposing or breaking down the base concept into smaller and smaller (and more and more detailed) components.
In either case the resultant models all depict some system component or part of a system component and as such, they can be used to model business environments and depict business component interrelationships. Regardless of whether they were developed on a top down, or a bottom up basis, all models will depict both the global and detail aspects of the system being proposed.
Processing Models
Business systems at their core consist of individual processing activities and tasks, and the data which is the subject of that processing. This data is thereby changed or altered in some way by that processing. These business processing operations, the activities and tasks, require other data which may be used in the processing operations but is not changed or altered - this is usually reference data. In many cases, the documents containing the data to be processed (the data carriers) also contain data which has accompanied the data to be processed but which is ignored or discarded during processing.
On an elementary level then, the components of any business systems design are the individual processing tasks and the data to be processed.
If this were all there was, the system designer's task would be very easy, but there is more. Activities and tasks occur in strings or sequences called processes, and processes are performed continuously and in an interdependent manner. The same data or documents in either original or modified form are used by many different processes, sometimes in sequence, sometimes concurrently. Data extracted from these original documents, either separately or in combination with data from other documents appear on new documents and reports which enter their own processing streams.
In many cases the processing which is applied to these documents is cumulative in nature, that is each successive process or task adds to, or modifies what was processed in a prior operation. In other cases, the processing is not continuous but occurs only during specified periods of time, only after specified periods of time have elapsed, or after other non-related operations have been performed. Between these processing operations, data must be stored for later retrieval.
Each of the above considerations, states and conditions are components of the system design: these include among others the network of processing operations, the data being processed, the time considerations, the temporary storage of data and its later retrieval, the combination and recombination of data fragments from original documents, and the control, validation and verification mechanisms.
The task of the designer is to determine the tasks to be performed, determine how those tasks are to be performed, to determine the data and information needs of each task, and to place all tasks within the above contextual framework.
The various processes and their data must be structured around a framework which allows the mutually interacting and interdependent processes to be performed efficiently and effectively.
It is the development of the framework which is the most critical part of the design process for it guides all subsequent design activities. In reality there are three separate frameworks, or components of the system framework - the composite framework, the data framework and the processing framework.
On a composite basis the framework model, or models must depict the processing, the processing dependencies and the processing sequences, the data needed by the processes, and the business context within which the processing of the data must occur.
A Definition:
There are many different types of system design models, and many models depict many different system components. Some models may isolate data and ignore process, others may isolate process and ignore data. Some models attempt to combine both data and process. There are no models which can easily and understandably represent all of the components of a system design, even at a single level, much less at all of the levels.
We have chosen three or four basic modeling notations which we will use throughout the remainder of this discussion. The choice is due to personal preference, and the fact that they are relatively well known, easy to use and flexible. They all have one other thing in common, they can be developed with little more than a common forms template, paper and pencil. Many of these have multiple proponents associated with them, each of whom has developed a variation on the common theme.
Our presentation is illustrative in nature and thus may combine components and techniques from multiple variations or take liberties with the techniques from time to time.
Many books have been published which describe these models and notational techniques in great detail, so it is unnecessary to do so here. We will examine the three or four we have chosen as a way of describing what models can depict, and how they do so.
The Data Flow Diagrams
Data flow diagrams are a result of a methodology usually referred to as structured system analysis and design.
The data flow diagrams as their name implies depict the flow of data into, from and between data transformation processes. A data transformation process is one which transforms input data into some form of output data. The orientation of data flow diagrams is the business process, the data which feed it, and the data which it generates. Thus, data flow diagrams, are a mechanism for depicting the system processes from the perspective of the relationships established between them by data moving from one to the other. This results in a view of the system from the processing perspective with respect to the data which is used by those processes.
A data flow diagram utilizes a simple set of symbols one of which represents a process, one which represents a data flow and the direction of the flow into or out of the process, and one which represents a data storage point.
In some instances a data flow diagram may also contain symbols which represent processing sequence terminators. A processing sequence terminator can be either a data source or data end user.
Data input to a process may originate with a terminator, another process or a data store. A data store is synonymous with a file, and is where data is held between noncontinuous processes. In a data flow diagram, all processes and data stores must have at least one input and one output.
Structured analysis and design and data flow diagramming are top down approaches. Data flow diagrams are developed from the successive decomposition of major business processes into smaller and smaller components. Thus, data flow diagrams are constructed in stages, or levels.
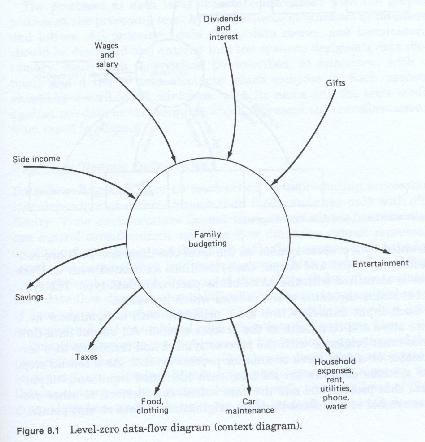
The first, or Level Zero (0) diagram is usually called the context diagram (figure 8-1), and contains a single process symbol which represents the entire processing system. To that process symbol are connected data flow lines representing all major inputs and outputs at the system level.
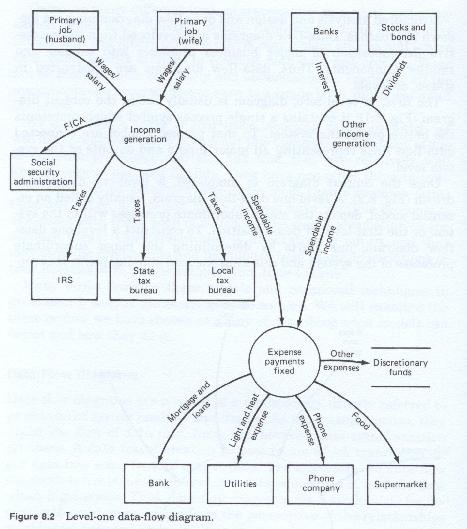
Once the context diagram is completed, a level one (1) diagram is drawn. A level one data flow diagram is usually called an essential model and depicts the major subordinate processes within the system or the first level of decomposition.
To construct a level one data flow diagram (figure 8-2), one first starts by determining the major subordinate processes of the system and selecting one as a starting point. This is represented by a process symbol on the level one diagram. To that symbol are connected any input and output data flow lines associated with it. Each line is identified with the name of the particular data type. The symbol contains the name of the process which it depicts.
Each input data flow line must originate with a terminator or a data store and terminate at the process symbol. All output data flow lines must originate with the process symbol and terminate at a terminator or a data store or another process symbol.
As a second step the system designer should take each identified input and output from that process and add either the data stores, terminators or other process symbol to represent the data origination or data receipt points.
The above process is repeated until all identifiable, and significant data flows, data stores, terminators and processes for that level have been added to the diagram. The final step is to number each of the process symbols.
Once the above process is completed, the system designer may proceed to the next level diagram. Each process in the higher level diagram is decomposed into its more detailed, component processes. For each of these more detailed component processes, each of its data flows, data stores, and terminators should be represented. The data flows, data stores or terminators here may be data flows, data stores or terminators which are carried down from the preceding level, or they may completely originate and terminate within the major process itself.
This diagram is completed when each of the major processes from the preceding level has been decomposed and diagrammed.
The leveling process is continued until the system designer arrives at a set of diagrams where the processes each represent a single task or data transformation with its associated input and output data flows and their associated data stores and terminators.
The processes at each level should be associated back to the parent process at the preceding level by means of some scheme of numbers or numbers and letters. All processes, data flows, data stores and terminators should be described and entered into the system designer's data dictionary. Each data flow should be described, at minimum, with a name and a list of data elements which compose it. Each process should be described, at minimum, with its name, and the tests made against the data, or the formulas which represent the transformations from input to output
Data Flow Diagram Deficiencies
Data flow diagrams have no mechanism for representing processing interdependencies, except through data flows, and then only with difficult. Time considerations cannot be represented nor necessarily can control considerations. Data flow diagrams cannot represent conditional processing and have difficulty in representing the interrelationships between low level processes which originate in different high level processes. Because of their file and data flow orientation, data flow diagrams have difficulty in presenting a unified view of data usage throughout the firm. This is especially true where data is extracted and recombined with other data to form new files.
Data flow diagrams are highly useful for developing portions of the processing context or framework. They break down when attempting to depict large complex, highly integrated systems. The reason for this breakdown can be illustrated rather easily. At each level of diagram there is a trade-off to be made. This trade-off is between decomposing each previous level process into a large number of more specific, more detailed sub-processes or into a smaller number of less specific, less detailed sub-processes. The fewer the number of sub-processes on a level the clearer the diagram but the less detailed the processes are as well.
If each succeeding level decomposes each preceding level process into the same number of sub-processes we can see that the number of processes at each successively lower level increases geometrically. The more detailed a higher level process diagram is (that is, the more subprocesses which are represented), the fewer levels it takes to decompose it into its atomic tasks but then the number of processes at each level increases. The less detailed the higher level process the more levels it takes to decompose it into its atomic tasks but the fewer the processes at each level. The end result should be the same since both methods should arrive at the same atomic level task.
In a highly complex integrated system, there are hundreds, and perhaps thousands of atomic tasks. It is very difficult to grasp the totality of these tasks when by necessity they are spread over large numbers of model document pages.
Flow Chart Diagrams
Flow Chart Diagrams are useful tools when one wishes to represent either the processing and decision logic flows within a particular proposed process, with its associated inputs and outputs, or the flow of an entire system, with all the various types of processing, preparation, inputs, outputs, data storage media and other hardware which are associated with it. Flow charts are also used very successfully to depict the detail steps which must occur within a specific task. Although used primarily is depicting automated system processing implementation flows, they can be equally useful in an environment where one has a mix of both automated and manual processes, data stores, forms, and hardware.
Flow chart diagrams use a variety of symbols, which singly or in combination represent the various data input and output sources, and media types, and the various processing and decision points and processing steps within a logical flow.
Most data processing hardware vendors, and many software vendors provide plastic templates with the various basic symbols depicted in cutout form. These symbols may be used singly, or combined with each other to form a large variety of symbols. Since there are a wide variety of different symbol sets in use, the system designer should clearly label each symbol used in a legend on his charts.
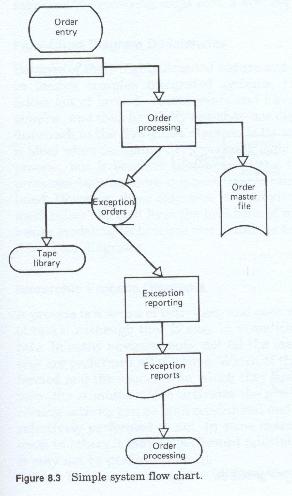
Flow chart diagrams depicting system flows (figure 8-3) are usually drawn in a linear fashion beginning to the top of the diagram, with either a manual operation, a form, a manual input or terminal input device, or a terminator which represents an end user. In some cases, flow charts may begin with a tape, disk, database, or other data store symbol. These symbols represent input sources and are connected to other symbols which represent either manual operations or automated processing points.
To each of these processing symbols is connected some output media symbol, either a tape, disk, form, or display station.
Each of these outputs are then connected either to another processing symbol as an input, (with other first use inputs, or inputs carried over from prior processing, or to a terminator, representing short or long term storage, or an end user.
This type of flow chart is completed when all processing boxes have been drawn and all outputs have been sent to storage or to a terminator.
Flow chart diagrams which depict processing and decision logic (figure 8-4) at the task level usually contain a more restricted set of symbols, usually process, input, output, decision, and terminator symbols. In some cases they may also contain data arranging symbols (sorting, collating, etc.). These flow charts are also drawn in a linear fashion, starting with some input at the top. Since these depict only the tasks and individual steps within a process, they do not represent external data storage or entities. Input and output symbols are drawn only to depict at what internal step the data either enters or is generated.
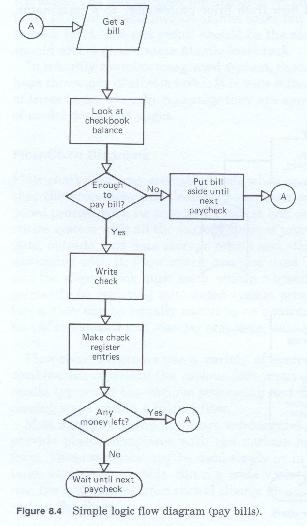
Normally, these intra-process or intra-task flow charts depict each separate step, and decision points in the data transformation or usage process. Decision points are usually depicted with each valid condition, or test result indicated as an exit path from the symbol. Each exit path leads to a separate processing leg or sequence of steps. These processing legs or sequence of steps, may remain separate for the remainder of the process, may join the main stream later in the processing flow, or may terminate after some error handling procedure.
In some cases, the may loop back, to some earlier point in the processing flow after corrective action has been taken, to remake the decision after additional processing has occurred or to repeat all or part of the entire sequence of processing steps with a new set of data.
Flow Chart Deficiencies
Because of their highly detailed nature, and because of the large number of tasks in today's complex integrated systems, flow chart diagrams have fallen out of favor in recent years and have been replaced by newer, simpler, and thus hopefully easier to use diagrammatic methods. One drawback to the flow chart diagram is its extreme detail. While this makes it ideal when designing the processing logic for a single task, or even a process, it becomes cumbersome and time-consuming when the processes become more complex, more integrated and more interrelated. However, these diagrams still provide the most detailed design mechanism, and still form the backbone of most system designs. Most newer modeling techniques and notations trace their ancestry back to flow chart diagrams.
Hierarchic Process Diagrams
A process is a series of activities, and each activity consists of a series of tasks. Although this view is easy to visualize, it is only partially accurate. In many environments, the tasks which constitute a process are not all performed all the time. The particular tasks performed, and the sequence in which they are performed is dependent upon the stimulus which activates the process. In other words, a processing activity can be both conditional and optional. Processes can be selectively performed or not. In some cases a task may be performed once, in other it may be performed multiple times, and in still other cases, it may not be performed at all.
Each task can be thought of as being dependent upon some preceding task or sequence of tasks. Viewed in this manner, all of the tasks which comprise a procedure can be viewed as being part of a hierarchy of tasks representing multiple task levels and multiple task sequence legs (Figure 8-5).
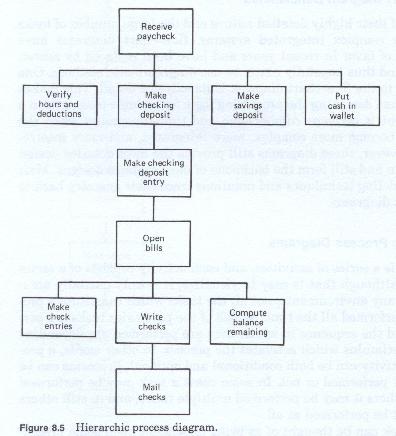
In all cases there is a primary, or root task. This task initiates or begins the process, and must which must precede all others. In effect this is the process entry task. This task, usually one which receives the input document, acts as the process organizer, and determines what later tasks must be performed. Once completed it passes data or control to one or more second level tasks each of which may be executed in a concurrent, sequential or random, mandatory, optional or mutually exclusive manner. Each of these tasks in turn may trigger, or call for the execution of still other tasks which may also be concurrent, sequential or random, and mandatory, optional or mutually exclusive.
This diagrammatic method is similar to a flow chart in that the flow of processes, or tasks can be easily represented. It differs from data flow diagrams and flow chart diagrams in that data is usually not represented. Another difference is that logical decisions are not depicted.
Its advantage is that it does depict optionality and sequence in both a horizontal and vertical manner. It suffers from the same geometric explosion of tasks at the lower levels that afflict data flow diagrams.
System design assumptions
Although it is difficult to do so, business system design must be dictated by the procedural needs of the business, not the methods which will be used to implement those procedures. That is, the system designer should not be influenced by the fact that the system will be automated, and how that automation will be implemented.
There are certain assumptions upon which we will base the remainder of our discussion of system design. They are summarized here so that the reader will understand our reasoning and thus follow along more easily.
The procedural and data requirement aspects of a business system design are separable from automated implementation considerations, and separable therefore from considerations of specific languages, software, and to an extent hardware.
Where automation is to be employed, the subsequent design of a data processing system must use the design of the business system as its base and seek to determine which business procedural tasks in the design can be automated and how that automation is to take place. There are two conditions which qualify this statement.
The first condition occurs when the firm initiates the system redesign process to take advantage of new automation hardware or software technology.
The second condition occurs when the firm initiates a system redesign to increase the level of integration between existing systems.
Under these two conditions the business system design may contain requirements and specifications which dictate the choice of language, software and hardware, and should explicitly state these under normal circumstances.
Top-down design starts with very high level view of the organization, and uses successive levels of decomposition to accomplish its work. A system design is complete at the point where a detailed specification for each procedure for each process, activity, task has been completed and where each data item needed by each task has been identified and specified.
Designing a system from its input gathering phases to its output generation phases, appears to be more efficient. The reasoning here is that there are a finite number of data sources for the business records of the firm, but a seemingly infinite number of ways in which that data can be manipulated and presented.
Most business procedures involve the generation, gathering, validation, examination, maintenance, modification, manipulation, filing and/or presentation of data. Most business processes, activities and tasks involve data directly as above, or indirectly in that data is recorded about the amount, type, quality or quantity of work performed. In some cases the data used by the process is internal to the process and controls the operation of the processes - that is it is processing related data not business related data.
The business's need for data dictates the procedures needed to gather, manipulate and present it. The quality and quantity of the data, the manner in which it becomes available, and the volatility of that data dictates the extent and complexity of the procedures necessary to validate, examine, maintain, modify, manipulate and file it. Thus, the business procedures are as much determined by the data they use as the data are determined by the procedures which use them.
System design components
The first phases of the system development life cycle involve three processes - analysis, examination and study, and modification and design. If we look at the time frames that each process focuses on we can see that analysis looks at the present, design looks at the future, and examination and study focus on the transition between present and future. Design can be though of as analysis of an environment which does not yet exist (the future or proposed environment). As such, design (or analysis of the future) must have techniques which can guide it in much the same way that current reality guides the analysis of the current system.
Analysis, examination and study, and modification and design all cover the transition from what is, to what should be. They must also make the determination as to how to get from here to there.
System design distinguishes between the roles people play (functions) or should play in the firm and the actions which they take (the processes, activities and tasks). This is the distinction between responsibility and authority to accomplish a given set of tasks (or to see that they are accomplished) and the accomplishment of those tasks.
Functions, are the reasons why people, or groups of people, perform their activities within the organization. Functions, are defined in terms of responsibilities, authorities and goals. A function may alter the manner in which it accomplishes its tasks but rarely does it have the ability to shift that responsibility for those tasks to other functions. In some cases functions may assume responsibility for certain tasks but may not have been assigned the appropriate authorities to accomplish those tasks.
Systems are what the people who populate a function do, and how they do it. Systems are defined in terms of process, activity and task descriptions; procedures; resources; time; quantity and quality of result.
A system is a collection of interrelated, interdependent processes. A process is a series of related activities. A task is a specific action or series of steps. One can make major changes to the tasks and not change the process of which it is a part. One can make a major change to the process and not change the function which manages and controls it. However, one can make a seemingly minor change to any one of the three and that seemingly minor change will have a major impact on, and thus make a major change to, all of the rest as well.
Design also looks at the reasons for those actions and the manner in which those actions are taken. One of the most valuable techniques in system design is the repetitive series of question each of which begins with "why" or "how."
The Concept of the five "Whys"
Most top-down design, or successive decomposition approaches incorporate the concept of the "five whys." This concept suggests that for each process being designed the designer ask the user "why are you doing that?" When the user gives the answer the designer asks again, "why are you doing that?" This is repeated three more times. When the question "why are you doing that?" is asked the fifth time you have reached the underlying reason for the task. This is the essence of the decomposition method.
An alternative set of questions might be "How is that process accomplished?" and in response to the user's answer the designer asks again "How is that process accomplished?" This repetitive questioning also continues to the fifth level. The last answer should provide a detailed description of the task steps involved
In later chapters we will be discussing some of the more important concepts underlying the design process. We will discuss the concept of system frameworks and how a system they can be constructed. We will discuss how individual procedures can be developed and how to determine the resources and data needs for each procedure.
As we have seen, system designs are conceptual and in most cases describe what are either intangible ideas and concepts, or objects which do not yet exist. The system design process is by its very nature a producer of semantic products. By this we mean that the end product, the designs, must be represented by words and pictures, diagrams and narrative rather than real things which can be seen and touched.
Thus we will be talking about the relationships between the words and pictures, in this case diagrams and words, and what they represent, what we think they represent or what they were supposed to represent. We will stress precision of word and meaning, and the need for unambiguous pictures, because clarity of communication between designer and client (the user) is critical. To paraphrase: "What you say should be what the client hears, and what the client understands should always be what you meant." This is the foundation of systems analysis and to a greater extent system design.
This book does not attempt to present a formal methodology. It does present those concepts and techniques which a systems designer should be familiar with and employ.
Part II of this book will deal with system frameworks, the various types of frameworks, how they can be constructed, and how they can be used.
Data Directed Systems Design - A Professional's Guide
Written by Martin E. Modell
Copyright © 2007 Martin E. Modell
All rights reserved. Printed in the United States of America. Except as permitted under United States Copyright Act of 1976, no part of this publication may be reproduced or distributed in any form or by any means, or stored in a data base or retrieval system, without the prior written permission of the author.