The various types of data models
Introduction
To begin our discussion of data models we should first begin with a common understanding of what exactly we mean when we use the term. A data model is a picture or description which depicts how data is to be arranged to serve a specific purpose. The data model depicts what that data items are required, and how that data must look. However it would be misleading to discuss data models as if there were only one kind of data model, and equally misleading to discuss them as if they were used for only one purpose. It would also be misleading to assume that data models were only used in the construction of data files.
Some data models are schematics which depict the manner in which data records are connected or related within a file structure. These are called record or structural data models. Some data models are used to identify the subjects of corporate data processing - these are called entity-relationship data models. Still another type of data model is used for analytic purposes to help the analyst to solidify the semantics associated with critical corporate or business concepts.
The record data model
The record version of the data model is used to assist the implementation team by providing a series of schematics of the file that will contain the data that must be built to support the business processing procedures. When the design team has chosen a file management system, or when corporate policy dictates that a specific data management system, these models may be the only models produced within the context of a design project. If no such choice has been made, they may be produced after first developing a more general, non-DBMS specific entity relationship data model.
These record data model schematics may be extended to include the physical parameters of file implementation, although this is not a prerequisite activity. These data models have much the same relationship to the building of the physical files and program specifications have to the program code produced by the programmers. In these cases, the data analysis activities are all focused on developing the requirements for and specifications of those files.
These models are developed for the express purpose of describing the "structure of data".
This use of the term presupposes that data has a structure. If we assume for the moment that data has a structure, or that data can be structured, what would it look like. For that matter what does data look like? The statement also presupposes that there is one way, or at least a referred way to model data.
Practically speaking however these models depict the "structure" or logical schematic of the data records as the programmer must think of them, when designing the record access sequences or navigational paths through the files managed by the data management systems.
With the above as an introduction, we can begin a discussion of data and data models. We will use the above as a common starting point, and a common perspective.
Early data models
Although the term data modeling has become popular only in recent years, in fact modeling of data has been going on for quite a long time. It is difficult for any of us to pinpoint exactly when the first data model was constructed because each of us has a different idea of what a data model is. If we go back to the definition we set forth earlier, then we can say that perhaps the earliest form of data modeling was practiced by the first persons who created paper forms for collecting large amounts of similar data. We can see current versions of these forms everywhere we look. Every time we fill out an application, buy something, make a request on using anything other than a blank piece of paper or stationary, we are using a form of data model.
These forms were designed to collect specific kinds of information, in specific format. The very definition of the word form confirms this.
A definition
Almost all businesses and in fact almost all organization use forms of every sort to gather and store information.
Why are forms used? A form is used to ensure that the data gathered by the firm is uniform (always the same, consistent, without variation) and can thus be organized and used for a variety of different purposes. The form can be viewed as a schematic which tells the person who is to fill it out what data is needed and where that data is to be entered. Imagine if you will what would happen if the firm's customer orders arrived in a haphazard manner, that is, in any way the customer thought to ask. Most of the orders would take a long time to interpret and analyze, much of the information that the firm needed to process the order would probably be missing, or at best be marginally usable by the firm.
In many firms, especially those who receive a large number of unsolicited orders, a large amount of time is spent in trying to figure out what the customer wanted, and whether in fact the customer was ordering one of the firm's products at all.
This is in contrast to those firms where orders come in on preprinted order forms of the company's design. While this doesn't ensure that the customer will fill out the form correctly at least there is the hope that the firm has communicated what it wants and needs.
Forms and automation
As firms began to use automation to process their data, it became more and more important to gather standardized data. Early computing machinery had little if any ability to handle data that was not uniform. Data was taken from the paper record forms and punched into card records which were then fed into machines. Machines that had minimal (by today's standards) logic capability. These machines performed the mechanical functions of totaling, sorting, collating and printing data but had little ability to edit that data. In fact these machines were highly sensitive to data which was not exactly in the expected form.
The card records to which the data was transferred for machine processing were initially designed to follow the sequence of data as it appeared on the form. New forms were designed on which the analyst could layout or structure the data fields (the components of the automated records) on the cards. Additional forms were designed to assist the analyst in designing the reports to be produced from that data. This process of designing card record and report layouts was probably the earliest examples of data modeling.
Although the media dictated the length constraints of the data entry and storage records (mainly 80 column cards), the analysts had some latitude within those constraints. The amount of data to be entered from a given form dictated the number of card records needed. The number of cards and the complexity of the data placed further constraints on the card layouts, the number of columns available, and the positioning of the fields on each card. Further constraints were imposed by the mechanical processing that had to be performed (sorting, merging, collating of cards) requiring control fields, sequence fields, and fields for identifying specific card formats. Multiple card formats were used to accommodate different kinds of data cards - name and address cards, account balance cards, order item cards, etc.
The influence of magnetic tape media
The introduction of magnetic tape media removed many of the constraints of size from data record layouts, but left many of the field sequence and record identification requirements. Although new record layout techniques were being developed, many of the early magnetic record layouts looked remarkably similar to their predecessor cards. Magnetic tape media also reduced the number of record format indicators needed to identify the various types and layouts of records. As experience with magnetic tape media increased many analysts experimented with larger and larger records, and introduced more descriptive data to accompany the process support data in the original files. This descriptive data allowed systems designers to provide more meaningful data to the business users.
Tape also allowed data to be more easily sorted, and data from multiple files to be merged and collated. Because of its ease of use and high capacity, many critical processing systems were, and still are based on tape based files.
Tape however still retained several limitations:
For instance, retention of monthly data required either one tape per month to be generated, thus requiring multiple tapes to be read to accumulate multi-month reports or month to month comparisons, or provisions had to be made within the tape record for monthly fields (commonly called "buckets") in which case depending upon the month one or more "buckets" would be empty or filled. The designer however had to make these layout choices during the design phase and then develop the processing procedures to accommodate that design choice.
Direct Access file storage
Almost concurrently with the introduction of tape record storage, the vendors introduced another magnetic storage media - commonly called disk or Direct Access Storage Devices (DASD). This form of media used rotating or spinning drums (a form that never really became popular because of its limited capacity and large size) or platters coated with magnetic material to store data, and used moveable arms equipped with heads for reading and writing data to the media.
The early versions of these devices were faster than tape, and allowed for direct access to data (facilitated by the moveable arms) but had fixed capacity which was much smaller than that of the tape units of the same period.
Although these devices allowed for greater processing flexibility early record design techniques for them was almost identical those used for tape records.
These devices however allowed vendors to develop and introduce additional methods of storing and accessing data based on the direct and random processing capabilities. These devices allowed data to be located based on physical media address and thus indices could be constructed which allowed for both sequential and random processing. These addresses also permitted various records to be tied together using the physical address as "pointers" from record to record. The standard vendor-supplied file access mechanisms however still required that all records in a given file have the same layout. Because the record access was relatively fixed, and because the record layouts were also relatively fixed there was no real need for a data model as such since all that was really necessary was to know what fields were contained in each record and to understand what order the fields appeared.
Data Management Systems
Until the introduction of data management systems (and data base management systems) data modeling and data layout were synonymous. With one notable exception data files were collections of identically formatted records. That exception was a concept introduced in card records - the multi-format-card set, or master detail set. This form of card record layout within a file allowed for repeating sets of data within specific a larger record concept - the so-called logical record (to distinguish it from the physical record). This form was used most frequently when designing files to contain records of orders, where each order could have certain data which was common to the whole order (the master) and individual, repetitive records for each order line item (the details). This method of file design employed record fragmentation rather than record consolidation.
To facilitate processing of these multi-format record files, designers used record codes to identify records with different layouts and redundant data to permit these records to be collected (or tied) together in sequence for processing. Because these files were difficult to process, the layout of these records, and the identification and placement of the control and redundant identifier data fields had to be carefully planned. The planning and coordination associated with these kinds of files constituted the first instances of data modeling.
The concepts associated with these kinds of files were transferred to magnetic media and expanded by vendors who experimented with the substitution of physical record addresses for the redundant data. This use of physical record addresses coupled with various techniques for combining records of varying lengths and formats gave rise to products which allowed for the construction of complex files containing multiple format records tied together in complex patterns to support business processing requirements.
These patterns were relatively difficult to visualize and schematics were devised to portray them. These schematics were also called data models because they modeled how the data was to be viewed. Because the schematics were based on the manner in which the records were physically tied together, and thus logically accessed, rather than how they were physically arranged on the direct access device, they were in reality data file structure models, or data record structure models. Over time the qualifications to these names became lost and they became simply known as data models.
Whereas previously data was collected into large somewhat haphazardly constructed records for processing, these new data management systems allowed data to be separated into smaller, more focused records which could be tied together to form a larger record by the data management system. The this capability forced designers to look at data in different ways.
Data management models
The data management systems (also called data base management systems) introduced several new ways of organizing data. That is they introduced several new ways of linking record fragments (or segments) together to form larger records for processing. Although many different methods were tried, only three major methods became popular: the hierarchic method, the network method, and the newest, the relational method.
Each of these methods reflected the manner in which the vendor constructed and physically managed data within the file. The systems designer and the programmer had to understand these methods so that they could retrieve and process the data in the files. These models depicted the way the record fragments were tied to each other and thus the manner in which the chain of pointers had to be followed to retrieved the fragments in the correct order.
Each vendor introduced a structural model to depict how the data was organized and tied together. These models also depicted what options were chosen to be implemented by the development team, data record dependencies, data record occurrence frequencies, and the sequence in which data records had to be accessed - also called the navigation sequence.
The hierarchic model
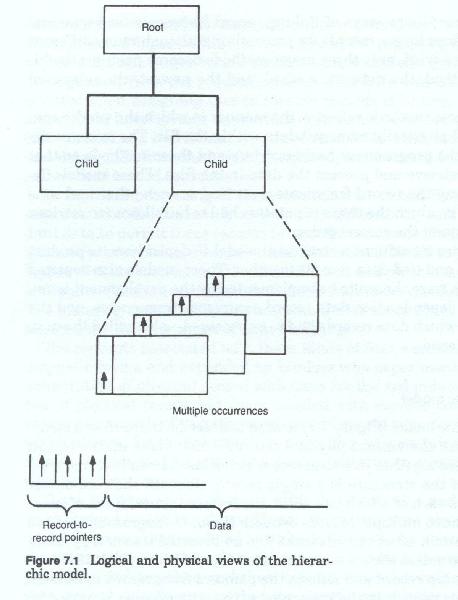
The hierarchic model (figure 7-1) is used to describe those record structures in which the various physical records which make up the logical record are tied together in a sequence which looks like an inverted tree. At the top of the structure is a single record. Beneath that are one or more records each of which can occur one or more times. Each of these can in turn have multiple records beneath them. In diagrammatic form the top to bottom set of records looks like a inverted tree or a pyramid of records. To access the set of records associated with the identifier one started at the top record and followed the pointers from record to record.
The various records in the lower part of the structure are accessed by first accessing the records above them and then following the chain of pointers to the records at the next lower level. The records at any given level are referred to as the parent records and the records at the next lower level that are connected to it, or dependent on it are referred to as its children or the child records. There can be any number of records at any level, and each record can have any number of children. Each occurrence of the structure normally represent the collection of data about a single subject. This parent-child repetition can be repeated through several levels.
The data model for this type of structural representation usually depicts each segment or record fragment only once and uses lines to show the connection between a parent record and its children. This depiction of record types and lines connecting them looks like an inverted tree or an organizational hierarchy chart.
Each file is said to consist of a number of repetitions of this tree structure. Although the data model depicts all possible records types within a structure, in any given occurrence, record types may or may not be present. Each occurrence of the structure represents a specific subject occurrence an is identified by a unique identifier in the single, topmost record type (the root record).
Designers employing this type of data management system would have to develop a unique record hierarchy for each data storage subject. A given application may have several different hierarchies, each representing data about a different subject, associated with it and a company may have several dozen different hierarchies of record types as components of its data model. A characteristic of this type of model is that each hierarchy is normally treated as separate and distinct from the other hierarchies, and various hierarchies can be mixed and matched to suit the data needs of the particular application.
The network model
The network data model (figure 7-2) has no implicit hierarchic relationship between the various records, and in many cases no implicit structure at all, with the records seemingly placed at random. The network model does not make a clear distinction between subjects mingling all record types in an overall schematic. The network model may have many different records containing unique identifiers, each of which acts as an entry point into the record structure. Record types are grouped into sets of two, one or both of which can in turn be part of another set of two record types. Within a given set, one record type is said to be the owner record and one is said to be the member record. Access to a set is always accomplished by first locating the specific owner record and then following the chain of pointers to the member records of the set. The network can be traversed or navigated by moving from set to set. Various different data structures can be constructed by selecting sets of records and excluding others.
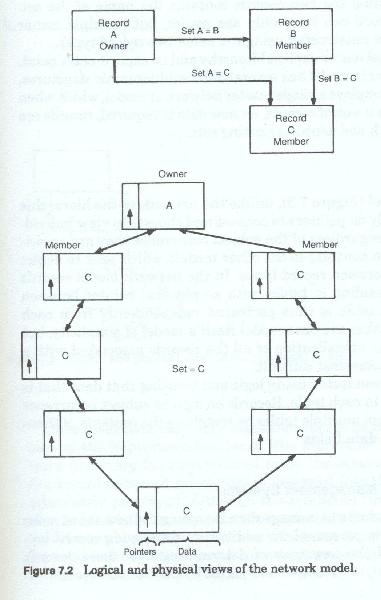
Each record type is depicted only once in this type of data model and the relationship between record types is indicated by a line between them. The line joining the two records contains the name of the set. Within a set a record can have only one owner, but multiple owner member sets can be constructed using the same two record types
The network model has no explicit hierarchy and no explicit entry point. Whereas the hierarchic model has several different hierarchies structures, the network model employs a single master network or model, which when completed looks like a web of records. As new data is required, records are added to the network and joined to existing sets.
The relational model
The relational model (figure 7-3), unlike the network or the hierarchic models did not rely on pointers to connect and chose to view individual records in sets regardless of the subject occurrence they were associated with. This is in contrast to the other models which sought to depict the relationships between record types. In the network model records are portrayed as residing in tables with no physical pointer between these tables. Each table is thus portrayed independently from each other table. This made the data model itself a model of simplicity, but it in turn made the visualization of all the records associated with a particular subject somewhat difficult.
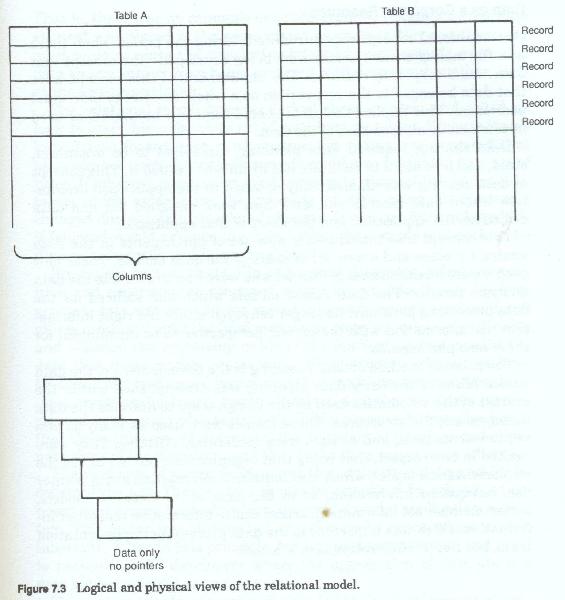
Data records were connected using logic and by using that data that was redundantly stored in each table. Records on a given subject occurrence could be selected from multiple tables by matching the contents of these redundantly stored data fields.
The impact of data management systems
The use of these products to manage data introduced a new set of tasks for the data analysis personnel. In addition to developing record layouts, they also had the new task of determining how these records should be structured, or arranged and joined by pointer structures.
Once those decisions were made they had to be conveyed to the members of the implementation team. The hierarchic and network models were necessary because without them the occurrence sequences and the record to record relationships designed into the files could not be adequately portrayed. Although the relational "model" design choices also needed to be conveyed to the implementation team, the relational model was always depicted in much the same format as standard record layouts, and any other access or navigation related information could be conveyed in narrative form.
Data as a corporate Resource
One additional concept was introduced during the period when these new file management systems were being developed - the concept that data was a corporate resource. The implications of concept were that data belonged to the corporation as a whole, and not to individual user areas. This implied that data should somehow be shared, or used in common by all members of the firm.
Data sharing required data planning. Data had to be organized, sized and formatted to facilitate use by all who needed it. This concept of data sharing was diametrically opposed to the application orientation where data records and data files were designed for, and data owned by the application and the users of that application.
This concept also introduced a new set of participants in the data analysis process and a new set of users of the data models. These new people were business area personnel who were now drawn into the data analysis process. The data record models which had sufficed for the data processing personnel no longer conveyed either the right information nor information with the correct perspective to be meaningful for these new participants.
The primary method of data planning is the development of the data model. Many of the early data planning was accomplished within the context of the schematics used by the design team to describe the data management file structures.
These models were used as analysis and requirements tools, and as such were moderately effective. They were limited in one respect, that being that organizations tended to use the implementation model, which also contained information about pointer use, navigation information, or in the case of the network models, owner-member set information, access choice information and other information which was important to the data processing implementation team, but not terribly relevant to the user.
Normalization
Concurrent with the introduction of the relational data model another concept was introduced - that of normalization. Although it was introduced in the early nineteen-seventies its full impact did not begin to be felt until almost a decade later, and even today its concepts are not well understood. The various record models gave the designer a way of presenting to the user not only the record layout but also also the connections between the data records. In a sense allowing the designer to show the user what data could be accessed with what other data. Determination of record content however was not addressed in any methodical manner. Data elements were collect into records in a somewhat haphazard manner. That is there was no rationale or predetermined reason why one data element was placed in the same record as another. Nor was there any need to do so since the physical pointers between records prevented data on one subject from being confused with data about another, even at the occurrence level.
The relational model however lacked these pointers and relied on logic to assemble a complete set of data from its tables. Because it was logic driven (based upon mathematics) the notion was proposed that placement of data elements in records could also be guided by a set of rules. If followed, these rules would eliminate many of the design mistakes which arose from the meaning of data being inadvertently changed due to totally unrelated changes. It also set forth rules which if followed would arrange the data within the records and within the files more logically and more consistently.
Previously data analysis, file and record designers, relied on intuition and experience to construct record layouts. As the design progressed, data was moved from record to record, records were split and others combined until the final model was pleasing, relatively efficient and satisfied the processing needs of the application that needed the data that these models represented. Normalization offered the hope that the process of record layout, and thus model development could be more procedurally driven, more rule driven such that relatively inexperienced users could also participate in the process. It was also hoped that these rules would also assist the experienced designer and eliminate some of the iterations, and thus make the process more efficient.
The first rule of normalization was that data should depend (or be collected) by key. That is, data should be organized by subject, as opposed to previous methods which collected data by application or system. This notion was obvious to hierarchic model users, whose models inherently followed this principle, but was somewhat foreign and novel to network model developers where the aggregation of data about a data subject was not as commonplace.
This notion of subject organized data led to the development of non-DBMS oriented data models.
The Entity-Relationship model
While the record data models served many purposes for the system designers, these models had little meaning or relevance to the users community. Moreover, much of the information the users needed to evaluate the effectiveness of the design was missing. Several alternative data model formats were introduced to fill this void. These models attempted to model data in a different manner. Rather than look at data from a record perspective, they began to look at the entities or subjects about which data was being collected and maintained. They also realized that the the relationship between these data subjects was also an area that needed to be modeled and subjected to user scrutiny. These relationships were important because in may respects they reflected the business rules under which the firm operated. This modeling of relationships was particularly important when relational data management systems were being used because the relationship between the data tables was not explicitly stated, and the design team required some method for describing those relationships to the user.
As we shall see later on, the Entity-Relatinship model has one other important advantage. In as much as it is non-DBMS specific, and is in fact not a DBMS model at all, data models can be developed by the design team without first having to make a choice as to which DBMS to use. In those firms where multiple data management systems are both in use and available, this is a critical advantage in the design process.
Data Analysis, Data Modeling and Classification
Written by Martin E. Modell
Copyright © 2007 Martin E. Modell
All rights reserved. Printed in the United States of America. Except as permitted under United States Copyright Act of 1976, no part of this publication may be reproduced or distributed in any form or by any means, or stored in a data base or retrieval system, without the prior written permission of the author.