Data Analysis and Systems Analysis
Analysis
Systems Analysis, and thus those data activities associated with it is essentially a fact gathering phase. It looks at what is happening in the business area under study, it develops documentation of the current environment which in turn acts as a foundation or starting point for any further analysis or redesign activities. Since systems design is essentially a redesign of the current environment, making changes to improve current effectiveness, efficiency and capability, as well as correcting flaws which may exist and adding capability which is lacking, the analysis team must have an accurate starting point.
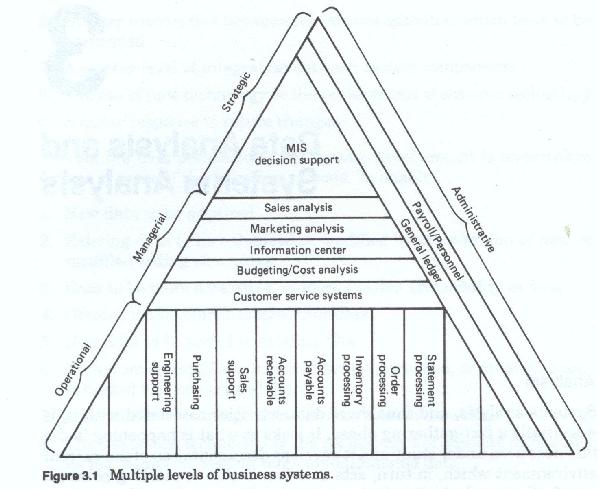
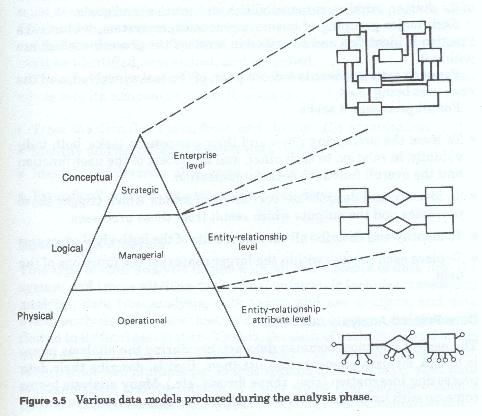
There are multiple levels of business activity. These levels of business activity can be roughly categorized into a strategic (or planning) level, a managerial (or monitoring and control) level, and an operational level. Each of these levels represents a different level of perspective on the firm, each of these requires a different level of data aggregation and different kinds of data. Stated in a different manner, each has different data needs and different ways of viewing that data. Each level also uses data in different ways.
Just as there are multiple levels (figure 3-1) of business activity, so to there are differences in the way data is both viewed and used between businesses. These differences are obvious when one looks at a manufacturing concern versus a service provider, and less obvious when one compares two firms in the same line of business. Differences exist when one looks at two firms with the same product lines, and who share the same customer base. Differences exist even when one looks at different divisions or even different departments of the same company.
Most methodologies recognize some of these differences and allow for analysis on multiple levels. Most methodologies do not allow for the differences in data perspective or data use. Almost all allow for multiple level analysis. Although there can be many levels, or successively more detailed iterations of analysis, for practical purposes most discussions are limited to three.
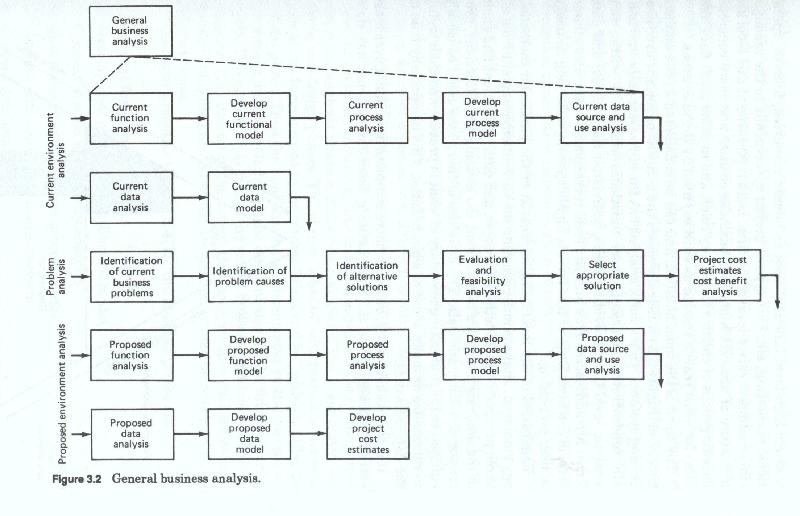
The first is usually labeled the general or business environmental analysis level (figure 3-2) and it concentrates on the firm wide functions, processes and data models. This has been called by some, enterprise analysis. This analysis at this level has the widest scope in terms of numbers of functions covered, and looks at the highest levels of the corporation. This level corresponds to the strategic level of the firm. This level does not treat data as such, but rather looks at higher levels of data abstraction - usually those persons, places, things and ideas which are labeled business entities.
The second, usually labeled detail business or client environmental analysis, and concentrates on the functions, processes and data of the individual client or user functional areas. This analytic level is narrower in scope than an enterprise level analysis, and may be limited to a single high level function, such as human resources, finance, operations, marketing, etc. This type of project corresponds to the managerial or administrative level of the firm. Data references at this level are a mixture of abstract high level business entities, and more concrete, specific groups of entities and entity roles, and in some cases data files (also for some reason treated as entities) used by the user areas.
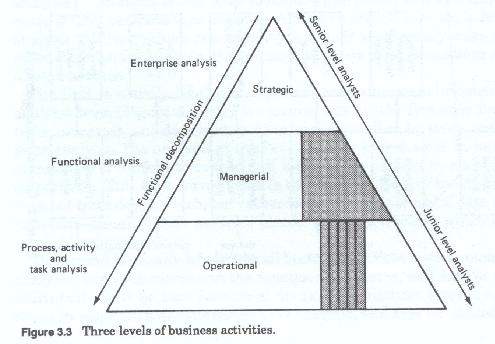
The third, is the most detailed, and can be considered as the application level (figure 3-3) which addresses the analysis of specific user processing systems. This level of analysis has the narrowest scope and usually concentrates on a single user functional area. It is within this analytic level that individual tasks and individual files records and data items are addressed. This analytic level corresponds to the operational level of the firm. Data at this level is highly specific, reflecting its usage in user processing.
Regardless of the level being addressed or the particular methodology employed, analysis must examine the current environment from all three perspectives - functional, process and data. The intent and goals of the analysis phase is to document the existing user functions, processes, activities and data. The activities of this phase could be loosely equated to those of taking inventory of what is present and then trying to rationalize or make sense of what was found. This is especially true of the data activities.
It is the need for more, better or more complete data that drives most system redesign projects. Most existing business systems use data which reflects old requirements, old business systems, or old business philosophies. What almost all analysts uncover as they progress through the analysis activities is that many of the concepts which form the foundation of the firm are not clearly understood, or worse have multiple definitions. Much of the data, because it is used primarily under local control, developed local definitions, which over time caused miscommunication between the various areas of the firm. This local definition caused even more miscommunication between the various levels of the firm, and in time hindered or completely prevented management's efforts at reorganizing, or changing the business activities and data availability to meet changing business needs.
The data analysis activities of the system analysis phase attempts to identify these data differences in preparation for resolving them and designing a consistent communication structure for the firm. Business data with consistent meaning, and appropriate organization, forms the heart of the business communications process.
The initial analysis or inventory identifies all current data, all current sources of that data, in all of its idiosyncratic forms, and more often than not, it identifies gaps in the company's data. These gaps take the form of user requirements for "new" data. New data can actually be new data, or as is more often the case it is existing data in a different form, a different organization, different levels of detail, different time frames, or in different combinations than current are available.
This inventory of "what is" added to the user's new requirements and need for revisions to existing files and data sources is the primary product of the analysis phase and the raw material of the examination and study, and design phases. The phrase "what is" with respect to the analysis phase is contrasted to the phrase "what will be" which typifies the design phase. Thus the analysis phase concentrates on the current environment while the design phase concentrates on the future environment. This statement is true to the extent that analysis looks at current systems. It is untrue to the extent that analysis also gathers requirements (unfulfilled needs) which are part of, or may become part of, the future system.
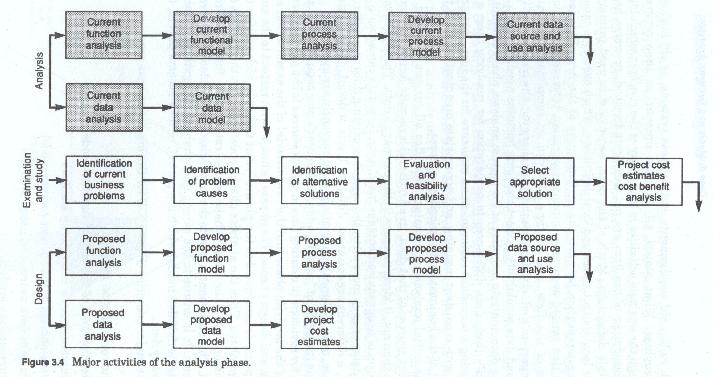
The major activities (figure 3-4) for the analysis phase are:
Each of the above major activities involves either process or data or both. Obviously the last three are data related analysis activities. Depending upon which methodology was chosen, the third and fourth activities could also be considered data analysis activities. This is especially true if the data flow diagram method has been chosen over the process decomposition method. Each of these activities focuses on some aspect of the current environment or some aspect of user requirements, and each develops some product (either a narrative or a graphic model (figure 3-5)).
The design of any new system must be predicated upon an understanding of the old system. The only exception to this is where there is no old system. It is the migration from account to customer orientations (a new philosophy or way of looking at the business) that drove many major banks, insurance companies and brokerage houses to major development projects to redesign and reorient their systems. This type of major change caused these firms to require the performance of completely new sets of activities. Activities with which the firm has no prior experience.
Many of these firms however, had a very difficult time in developing these systems, especially in the analysis and design stages. This difficulty arose because many of them could not or did not understand who or what their customers were. That is the could not create a definition of a customer such that they could identify and describe one. Many of the firms had many different types of customers with ill-defined differences between them. For instance, many brokerage houses could not distinguish practically, between retail customers and institutional customers. Many insurance houses could not differentiate between customers and policy holders.
The bulk of the analytic activities in these firm's were focused on determining how and where customer data was currently acquired, and not on what a customer was. That is, not on what kinds of people or organizations made up the customer base but on what kinds of information the firm needed to acquire and maintain about those customers. Without an understanding of what the customer was, many of the systems designs that resulted were inadequate for the firm's needs.
Process related activities
During the analysis phase, each function is described in detail in terms of its charter, mission, responsibilities, authorities, and goals.
Each major grouping of business processes, or system, within each function is identified and described in terms of the processes which are within it.
For each activity there is a description of the tasks involved, and the resources being used.
For all processes it seeks:
Data related analysis activities
The easiest and most common data activity during the analysis phase is to look for data elements and list them. That is describe their data processing incarnation (size, shape format, etc.). Many analysis teams come up with long lists of these data elements. These elements, gleaned from file and reports. This activity, while it has some value is meaningless unless the analysis team also take the time, (lots of time) to define each element (or as is more often the case identify each of the multiple, and sometimes conflicting definitions of each element) and to determine which elements are in fact the same, regardless of the label attached to them. Most older systems, both manual and automated, have their own data files. These files many be electronic or paper, or some combination of both.
These files contain data, designed for that business system, and named according to the whim, logic or even standards of the team responsible for their design. Individually, the data in these files is consistent and usually minimally redundant, however in combination with files from other systems, the results are chaos. In almost all cases, there are no clear definitions of these data elements, and without clear definitions, there is no way to determine when elements are the same or different. In many cases without clear definitions there is no way to determine what the data element content represents, or even what it should represent.
Within the analysis phase, all sources of data and information must be identified and all uses to which that data and information is put must also be identified. All data forms, reports and files must be identified and their contents inventoried.
All data flows between functions, processes, activities, and tasks must be identified, researched and described.
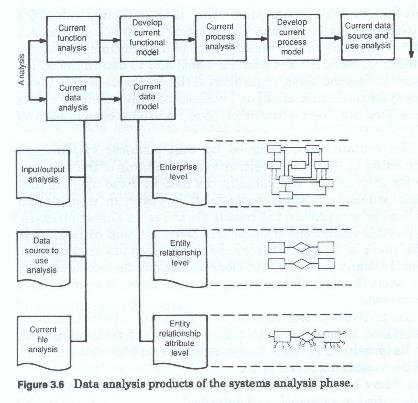
The analysis process (figure 3-6) seeks to decompose a complex whole into its component parts.
It seeks to:
Input/Output Analysis
This type of data analysis begins with all entry points of data into the system and traces all flows to the final outputs. It includes transaction analysis, data flow analysis, data source and use analysis, and data event analysis. For these methods each data input to the system is flowed to its final destination. That is, the path of each input, and sometimes each data element is traced through the firm, and documented. Where there are multiple paths that specific data can take, each path is documented, and the conditions under which that path is or should be taken is documented. This type of analysis and documentation is different from the traditional structured analysis techniques, also call data flow diagrams which are in reality data flow decomposition diagrams. Data transformations and manipulations are examined (using data flow diagrams) and outputs are documented. This type of analysis is usually left to right, in that the inputs are usually portrayed as coming in on the left and going out from the right. Data flow analysis techniques are used to depict the flow through successive levels of process decomposition, arriving ultimately at the unit task level.
Analysts performing this analysis must take care to include in their documentation all copies made of input forms and reports, and all points within the firm that data contained on forms and reports is reentered into other reports and personal computers. This type of activity is especially prevalent in staff offices where analysis of company performance is accomplished for the firm's management. The path of each copy of each multi-part form must be traced and documented, along with the reason for each copy, and careful notes should be take as to when these forms and reports, and copies are annotated with additional data, or when corrections are made.
Validation of these methods requires that the analyst and user work backward from the outputs to the inputs. To accomplish this, each output or storage item (data items which are stored in on-going files - also an output), is traced back through the documented transformations and processes to their ultimate source. Output to input validation does not require that all data inputs be used, however all output or stored data items used must have an ultimate input source, and should have a single input.
Input to output validation works in the reverse manner. Here, each input item is traced through its processes and transformations to the final output.
Validation of output to input, or input to output, analysis looks for multiply sourced data items, and data items acquired but not used.
Data Source to Use analysis
This method of data analysis is approached at the data element level, and disregards the particular documents which carry the data. The rationale for this type of data analysis is that data, although initially aggregated to documents tends to scatter, or fragment within the data flows of the firm. Conversely, once within the data flows of the firm, data tends to aggregate in different ways. That is, data is brought together into different collections, and from many different sources for various processing purposes.
Some data is used for reference purposes, and some generated as a result of various processing steps, and various transformations. The result is a web of data which can be mapped irrespective of the processing flows. The data flow models, and the data models from the data analysis phases are particularly useful here. The analyst must be sure to cross-reference and cross-validate the data model from the existing system.
Validation of the Analysis
Although not a definable phase within the system development life cycle, the validation of this stage of the data analysis is important enough that it deserves separate treatment.
The completed analytic documentation must be validated to ensure that:
The validation of the products of the analysis phase must address the same two aspects of the environment: Data and the processing of data.
A system is a complex whole. Old systems are not only complex, but in many cases, they are a patchwork of processes, procedures and tasks which were assembled over time, and which may no longer fit together into a coherent whole. Many times needs arose which necessitated the generation of makeshift procedures to solve a particular problem. Over time these makeshift procedures become institutionalized. Individually they may make sense, and may even work, however, in the larger context of the organization, they are inaccurate, incomplete and confusing.
Most organizations are faced with many of these systems which are so old, and so patched, incomplete, complex and undocumented that no one fully understands all of the intricacies and problems inherent in them, much less has a overview picture of the complete whole. The representation of the environment as portrayed by the analyst may be the first time that any user sees the entirety of the functional operations. If the environment is particularly large or complex, it could take both user and analyst almost as long to validate the analysis as it did to generate it, although this is probably extreme.
Validation seeks to ensure that the goals of analysis have been met, and that the documents which describe the component parts of the system are complete and accurate. It also attempts to ensure that for each major component, the identified subcomponent parts recreate or are consistent with the whole.
To use an analogy, the process of system analysis and system design are similar to taking a broken appliance apart, repairing the defective part and putting it back together again. It is easy to take the appliance apart, somewhat more difficult to isolate the defective part and repair it, and most difficult to put all the pieces back together again so that it works. The latter is especially true when the schematic for the appliance missing, incomplete or worse inaccurate.
If during the repair process new, improved, or substitute parts or components are expected to replace some of the existing parts, or if some of the existing parts are being removed because they are no longer needed, the lack of proper documentation becomes a problem almost impossible to overcome.
The documentation created as a result of the analysis is similar to the creation of a schematic as you disassemble the appliance, the validation process is similar to making sure that all the pieces are accounted for on the schematic you created. However because your intent is to repair and improve, the documentation you create must not only describe where each component fits, but why it is there, what its function is, and what if any problems exist with the way it was originally engineered and constructed.
Validation must not only ensure that existing procedure is correctly documented, but also that to the extent possible, the reasons or rationale behind the procedures has also been documented.
The validation of the products of analysis seeks to ensure that the verifier sees what is there and not what should be there.
Systems analysis, by its very nature works to identify, define and describe the various component pieces of the system. Each activity and each investigation seeks to identify and describe a specific piece. The piece may be macro or micro, but it is nonetheless a piece. Although it is usually necessary to create overview models, these overview levels, at the enterprise and functional levels, seek only to create a framework or guidelines for the meat of the analysis, that which is focused in on the operational tasks. It is the detail at the operational levels which can be validated. The validation process of both data and process work at this level. Each activity, each output and each transaction, identified at the lowest levels, must be traced from its end point to its highest level of aggregation or to its point of origination.
In the analysis, the analyst is fact gathering, and seeking to put together a picture of the current environment.
During validation the analyst begins with an understanding of the environment and the pictures or models he has constructed. The aim here however is to determine:
It must be understood that the analysis documents represent a combination of both fact and opinion. They are also heavily subjective. They are based upon interview, observation and perception. Validation seeks to assure that perception and subjectivity have not distorted the facts.
The generation of diagrammatic models, at the functional, process and data levels, greatly facilitates the process of validation. Where these models have been drawn from the analytical information, and where they are supplemented by detailed narratives, the validation process may be reduced to two stages.
Stage one - Cross-referencing the diagrams to the narratives, to ensure that:
Stage two - Cross-referencing across the models. This includes ensuring that:
Walk-Throughs
Walk-throughs are one of the most effective methods for validation. In effect they are presentations of the analytical results to a group of people who were not party to the initial analysis. This group of people should be composed of representatives of all levels of the affected user areas as well as the analysts involved. The function of this group is to determine whether any points have been missed. In effect this is a review committee.
Since the analysis documentation should be self-explanitory and non-ambiguous, it should be readily understandable by any member of the group. The walk-through should be preceded by the group's members reading the documentation and noting any questions or areas which need clarification. The walk-through itself should take the form of a presentation by the analysts to the group, and should be followed up
by question and answer periods. Any modifications or corrections required to the documents should be noted. If any areas have been missed, the analyst may have to perform the needed interviews and a second presentation may be needed. The validation process should address the documentation and models developed from the top two levels - the strategic and the managerial - using the detail from the operational.
Each data item contained in each of these detail transactions should be traced through these models, end to end. That is, from its origination as a source document, through all of its transformations into output reports and stored files. Each data element, or group of data elements contained in each of these stored files and output reports, should be traced back to a single source document.
Each process, which handles an original document or transaction, should be traced to its end point. That is the process to process flows should be traced.
Data Analysis, Data Modeling and Classification
Written by Martin E. Modell
Copyright © 2007 Martin E. Modell
All rights reserved. Printed in the United States of America. Except as permitted under United States Copyright Act of 1976, no part of this publication may be reproduced or distributed in any form or by any means, or stored in a data base or retrieval system, without the prior written permission of the author.